
Reading your Results Report - Percentages
Interpreting the results of the Describe - Percentages function
The results report for your percentages contains frequency and different kinds of percentage data for each variable you selected for analysis.
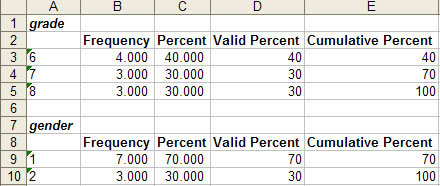
In the example above, the variables "grade" and "gender" were selected for analysis.
Definitions for the columns are as follows:
Frequency. This is the total number of cases that there are for each level of the variable. In the example above, we can see that there are 4 students in 6th grade, and 3 each in 7th and 8th grade. If your variable had missing values, a row would be displayed indicating how many missing values there were.
Percent. This is the percent of the total number of cases that each level of the variable contains. In the example above, we can see that 70% of the students had a gender of 1 (male), while the remaining 30% had a gender of 2 (female). If your variable had missing values, a row would be displayed indicating the percent of the total number of cases that contained missing values.
Valid Percent. This column is only useful if you have missing values; otherwise, the results are identical to the "Percent" column. If you do have missing values, the Valid Percent column contains the percentage of the total for each level of the variable, not including missing values.
Cumulative Percent. This column simply adds up the valid percents to obtain a total of 100.