
Reading your Results Report - Descriptive Statistics
Interpreting the results of the Describe - Descriptive Statistics function
The results report for your descriptive statistics contains information critical to the interpretation of your results. You have several options for describing your data (mean, standard deviation, range, etc); each of these will be desribed below.
 |
Definitions of each descriptive statistic are provided below
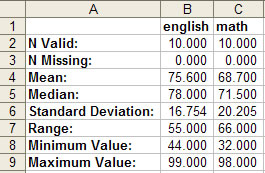
Above is an example of a results report for two variables, "english" and "math."
The results report for this analysis is structured so that the columns contain all of the variables you selected for analysis, while the rows contain the descriptive statistics. In the example, the first two rows of the results report "N valid" and "N missing" are always included in the results report; you are only required to have one of the remaining descriptive statistics included in your results report.
N Valid - The number of cases in the variable with valid values (ie., not missing values)
N Missing - The number of cases in the variable that were missing (ie., not valid)
Mean - For each selected variable, reports the average for all of the cases in your sample
Median - For each selected variable, reports the value that falls halfway between the highest score and the lowest score
Minimum value - For each selected variable, reports what the lowest number is
Maximum value - For each selected variable, reports what the highest number is
Standard deviation - For each selected variable, reports how far on average each score deviates from the mean
Range - For each selected variable, reports what the total number of scores are (minimum value subtracted from maximum value)
Sum - The total of all scores in the variable added together