
Setting up your data sheet
For EZAnalyze to work smoothly, the Excel file that you use to provide the data for analysis needs to be set up with a few simple rules in mind. While there may be exceptions to these guidelines, following them will have you spending less time preparing your data, and more time analyzing it!
Sample of what your data should look like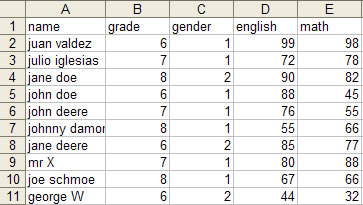
Notice how the first row contains the variable names, and rows 2-11 contain the values for each case
ROWS - Each row
in your Excel data sheet (rows are numbered down the left side) should
contain one "case." Usually,
each row will contain data from one student or person. However, if your
data is from schools in a district, and you are looking at how schools
are different from one another, your "cases" would then be
each individual school, and you would put each schools data
into the rows.
THE FIRST ROW IN YOUR DATA SHEET MUST CONTAIN VARIABLE NAMES! (see COLUMNS below)
COLUMNS - Each column in your Excel data sheet (columns are lettered across the top) should contain one "variable." EZAnalyze reads the variable names it will use for your analyses from the first row of data. The ability of EZAnalyze to read these variable names from the first row of data is what makes it special - and what makes it easy for you to analyze your data.
MISSING VALUES - Sometimes,
you might have some data that is "missing." While
you should make every effort to make sure that you
have all of the data for each case, sometimes that
is not possible. When this happens, you should leave
the cell blank - do not put a number, letter, or anything
in the cell where you have missing data. EZAnalyze
will tell you how many missing values you have if you
use the DESCRIBE - PERCENTAGES function.
You can still calculate descriptive statistics using
the DESCRIBE - DESCRIPTIVE
STATISTICS function - the mean, median, and mode
can still be calculated using all of the data that
is valid (not missing).
For specific information on how missing values affect
the creation of new variables, see the help topic
associated with NEW VARIABLES
SIZE - EZAnalyze can work with Excel data sheets that are 256 columns wide and over 65000 rows long. If you are looking at data that contains more than 256 variables and 65000 cases, you should probably look into buying more powerful statistical analysis software such as SPSS.
DATA - EZAnalyze works best when all of the data (values contained in each cell) are numbers - HOWEVER, there are some exceptions. For example, if you have a variable named "gender" (see example above), you could represent "males" with a 1 and "females" with a 2. Since "gender" is what is known as a categorical variable (a variable that creates categories for naming purposes only - glossary), you will not be computing descriptive statistics such as means and standard deviations. In this case, then you can type "male" or "female" into your data sheet instead of numbers. TO BE CLEAR, however, you will always be safe if you use numbers.