
Reading your Results Report - Disaggregate
Interpreting the results of the Disaggregate function
The results report for your disaggregation analysis contains several pieces of information that are important to properly interpret your results.
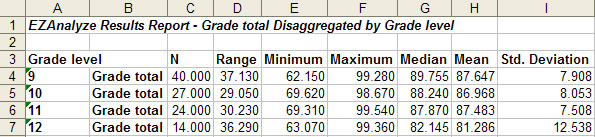
Example disaggregation results report.
The results report is structured so that the very first row tells you what the analysis is - Grade total (dependent variable) disaggregated by Grade level (categorical variable),
The remainder
of the results report is a table - the first column (column
A) in the table contains the levels of your categorical variable. In the
example,
the variable "Grade level" contained four levels - grade 9,
grade 10, grade 11, and grade 12.
The second column contains the name of your selected dependent variable(s)
(Grade total in the example above) and the third column is the valid N, which
is the number of valid values (or non-missing values) that were included in
the analysis.
If you
are double disaggregating your data, you will have two columns of categorical
variables.
The remaining columns contain the descriptive statistics you selected for the
disaggregation analysis. Definitions can be found HERE.